- 16 Tháng bảy 2020
- 709
- 2,319
- 231
- Hà Tĩnh
- THCS Lê Bình
 [TẶNG BẠN] TRỌN BỘ Bí kíp học tốt 08 môn
Chắc suất Đại học top - Giữ chỗ ngay!!
ĐĂNG BÀI NGAY để cùng trao đổi với các thành viên siêu nhiệt tình & dễ thương trên diễn đàn.
[TẶNG BẠN] TRỌN BỘ Bí kíp học tốt 08 môn
Chắc suất Đại học top - Giữ chỗ ngay!!
ĐĂNG BÀI NGAY để cùng trao đổi với các thành viên siêu nhiệt tình & dễ thương trên diễn đàn.
WRITING TASK 1
You should spend about 20 minutes on this task.
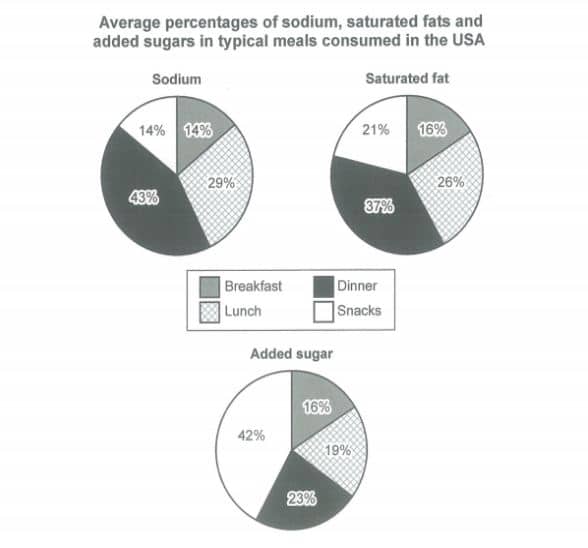
The charts below show the average percentages in typical meals of three types of nutrients, all of which may be unhealthy if eaten too much.
Summarise the information by selecting and reporting the main features, and make comparisons where relevant.
Write at least 150 words.

@Nguyễn Phan Ánh Nguyệt
You should spend about 20 minutes on this task.
The charts below show the average percentages in typical meals of three types of nutrients, all of which may be unhealthy if eaten too much.
Summarise the information by selecting and reporting the main features, and make comparisons where relevant.
Write at least 150 words.
@Nguyễn Phan Ánh Nguyệt